CLIENT
Industry
services & TECHNOLOGIES
Duration
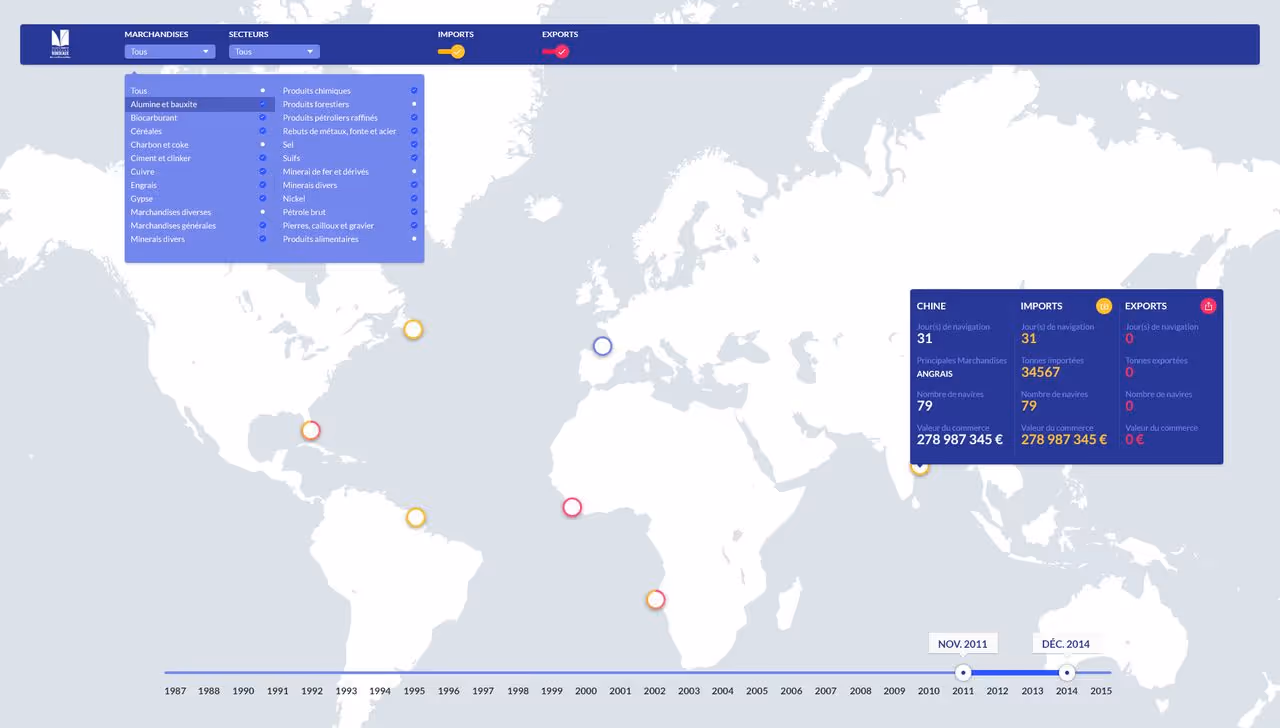
The Port of Bordeaux now uses a custom interactive platform to visualize 20 years of trade activity with countries around the world, filtered by product, industry, and time period.
The Port of Bordeaux manages a complex network of maritime trade routes with hundreds of partner ports worldwide. To better understand and communicate the evolution of its import/export activity, the Port commissioned 10h11 to design a fully interactive map powered by 20 years of historical trade data. The platform enables users to explore flows of goods between Bordeaux and the world in just a few clicks. Using dynamic filters — by product type, industry sector, and year range — stakeholders can analyze trends, identify strategic routes, and evaluate the port’s international impact over time. This tool combines big data, cartographic design, and intuitive UX to make global maritime trade data accessible, useful, and engaging.

The need
The Port of Bordeaux wanted to provide an intuitive and visually engaging way to explore its historical trade flows.
The objective was to centralize 20 years of import/export data and allow stakeholders, from public institutions to economic actors, to better understand the port’s commercial dynamics.
The solution
10h11 designed a custom interactive map enriched with big data features.
The platform allows users to:
- Filter trade flows by type of goods and economic sector
- Select custom year ranges via a dynamic timeline
- Visualize connections between Bordeaux and international ports
- Analyze the evolution of trade intensity and diversification over time
The result is a powerful exploration tool that brings 20 years of maritime trade data to life.
The outcome
The Port of Bordeaux now has a scalable and impactful way to showcase its global footprint.
The platform enhances internal analysis, public communication, and long-term planning by making decades of complex trade data easy to explore, compare, and understand.