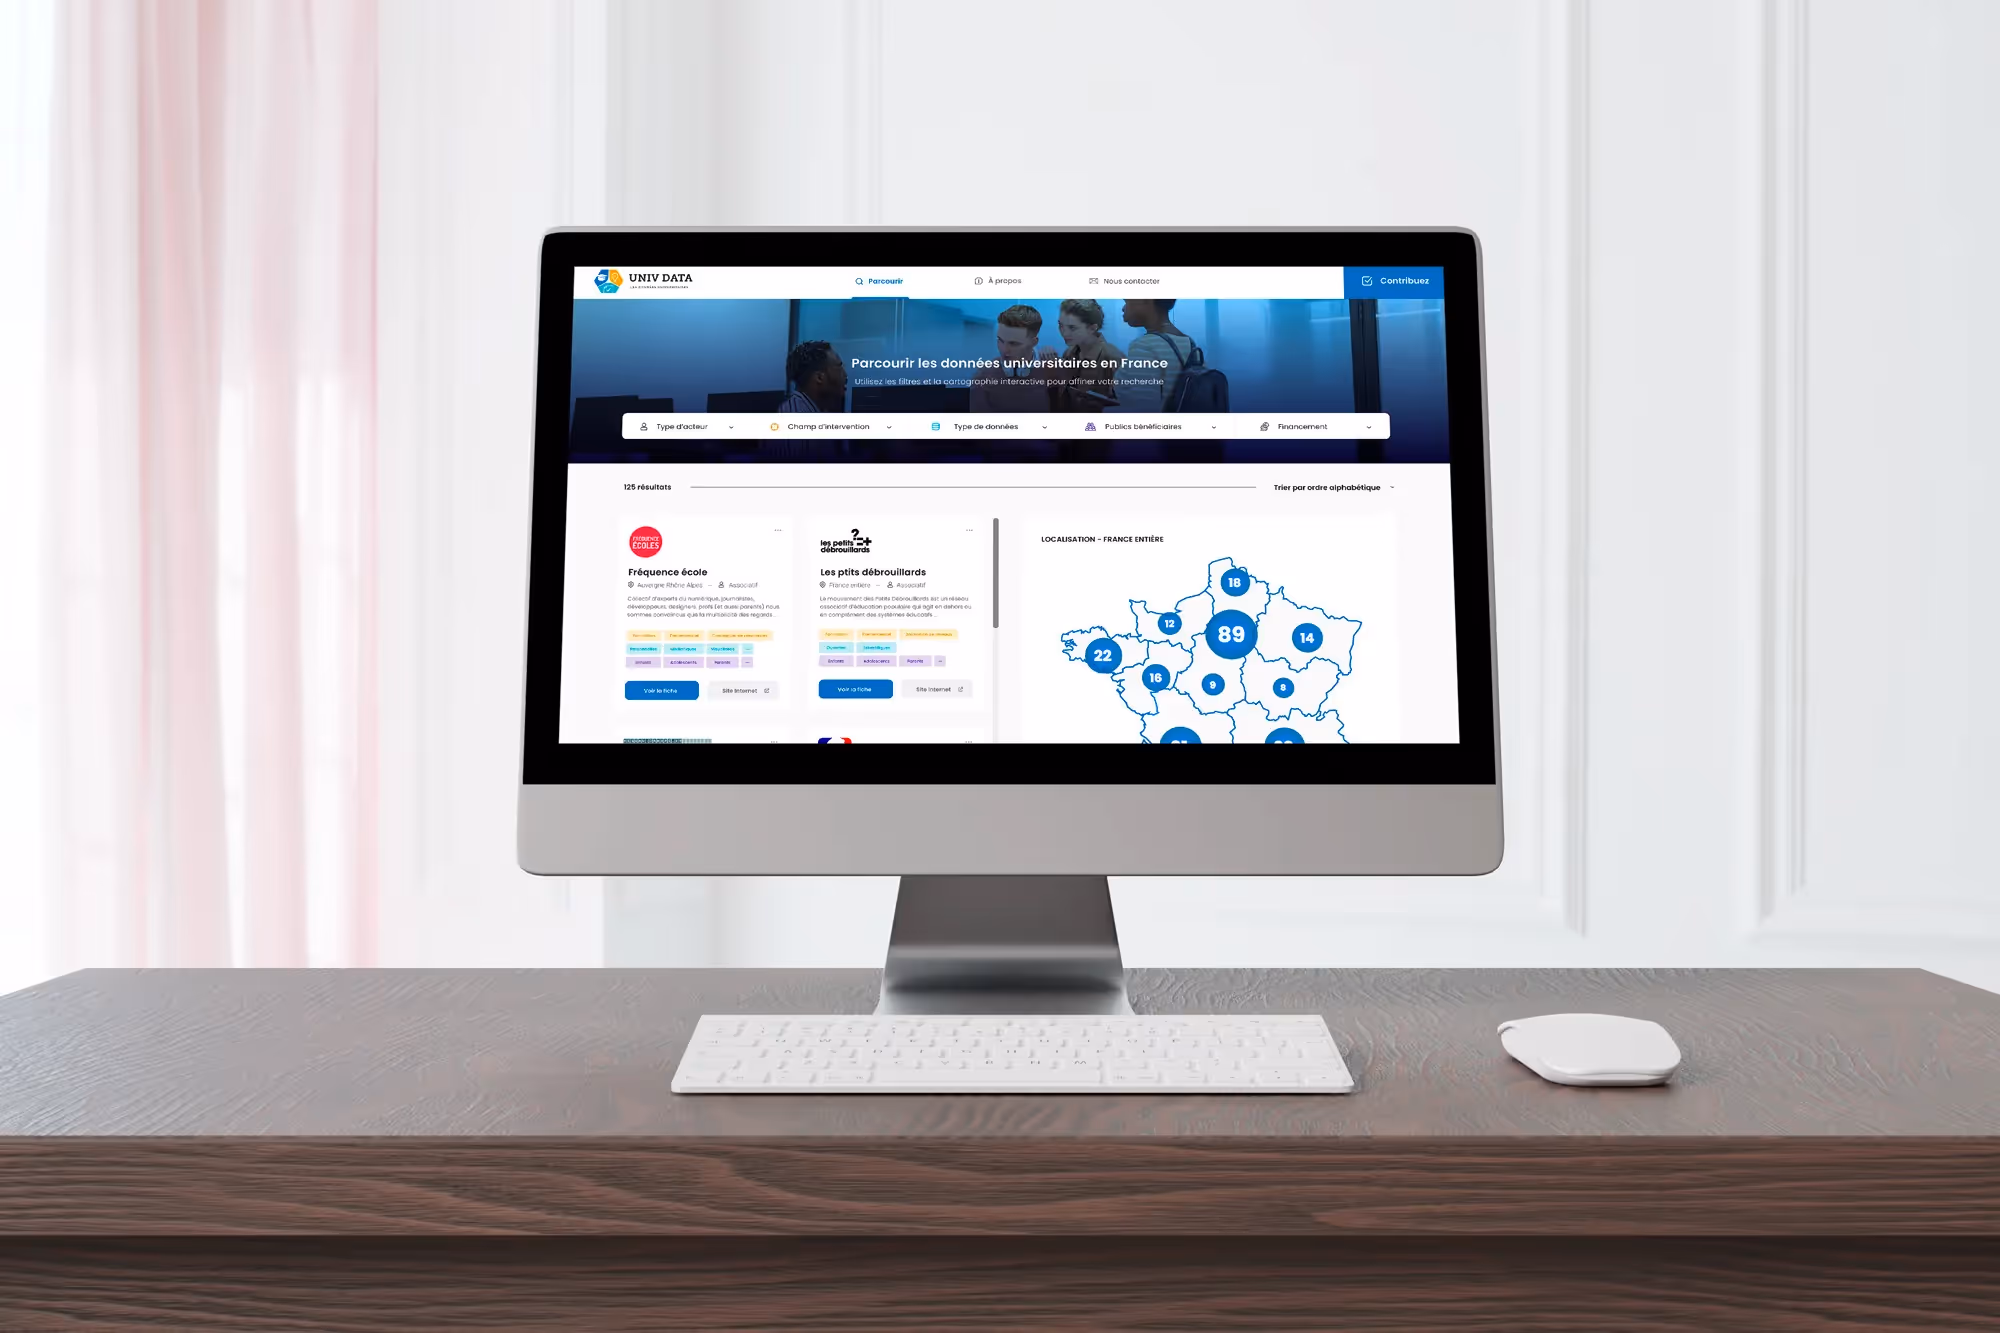
10h11 developed an interactive mapping solution for a university laboratory, allowing intuitive exploration of data research projects.
The democratization of university research requires innovative and accessible tools. Our collaboration with a research laboratory demonstrates how the alliance between advanced visualization and decision-making design can transform access to academic knowledge.

The need
The laboratory had to meet several challenges:
- Making a vast set of research data accessible
- Allow intuitive exploration of projects
- Facilitate the updating of partner information
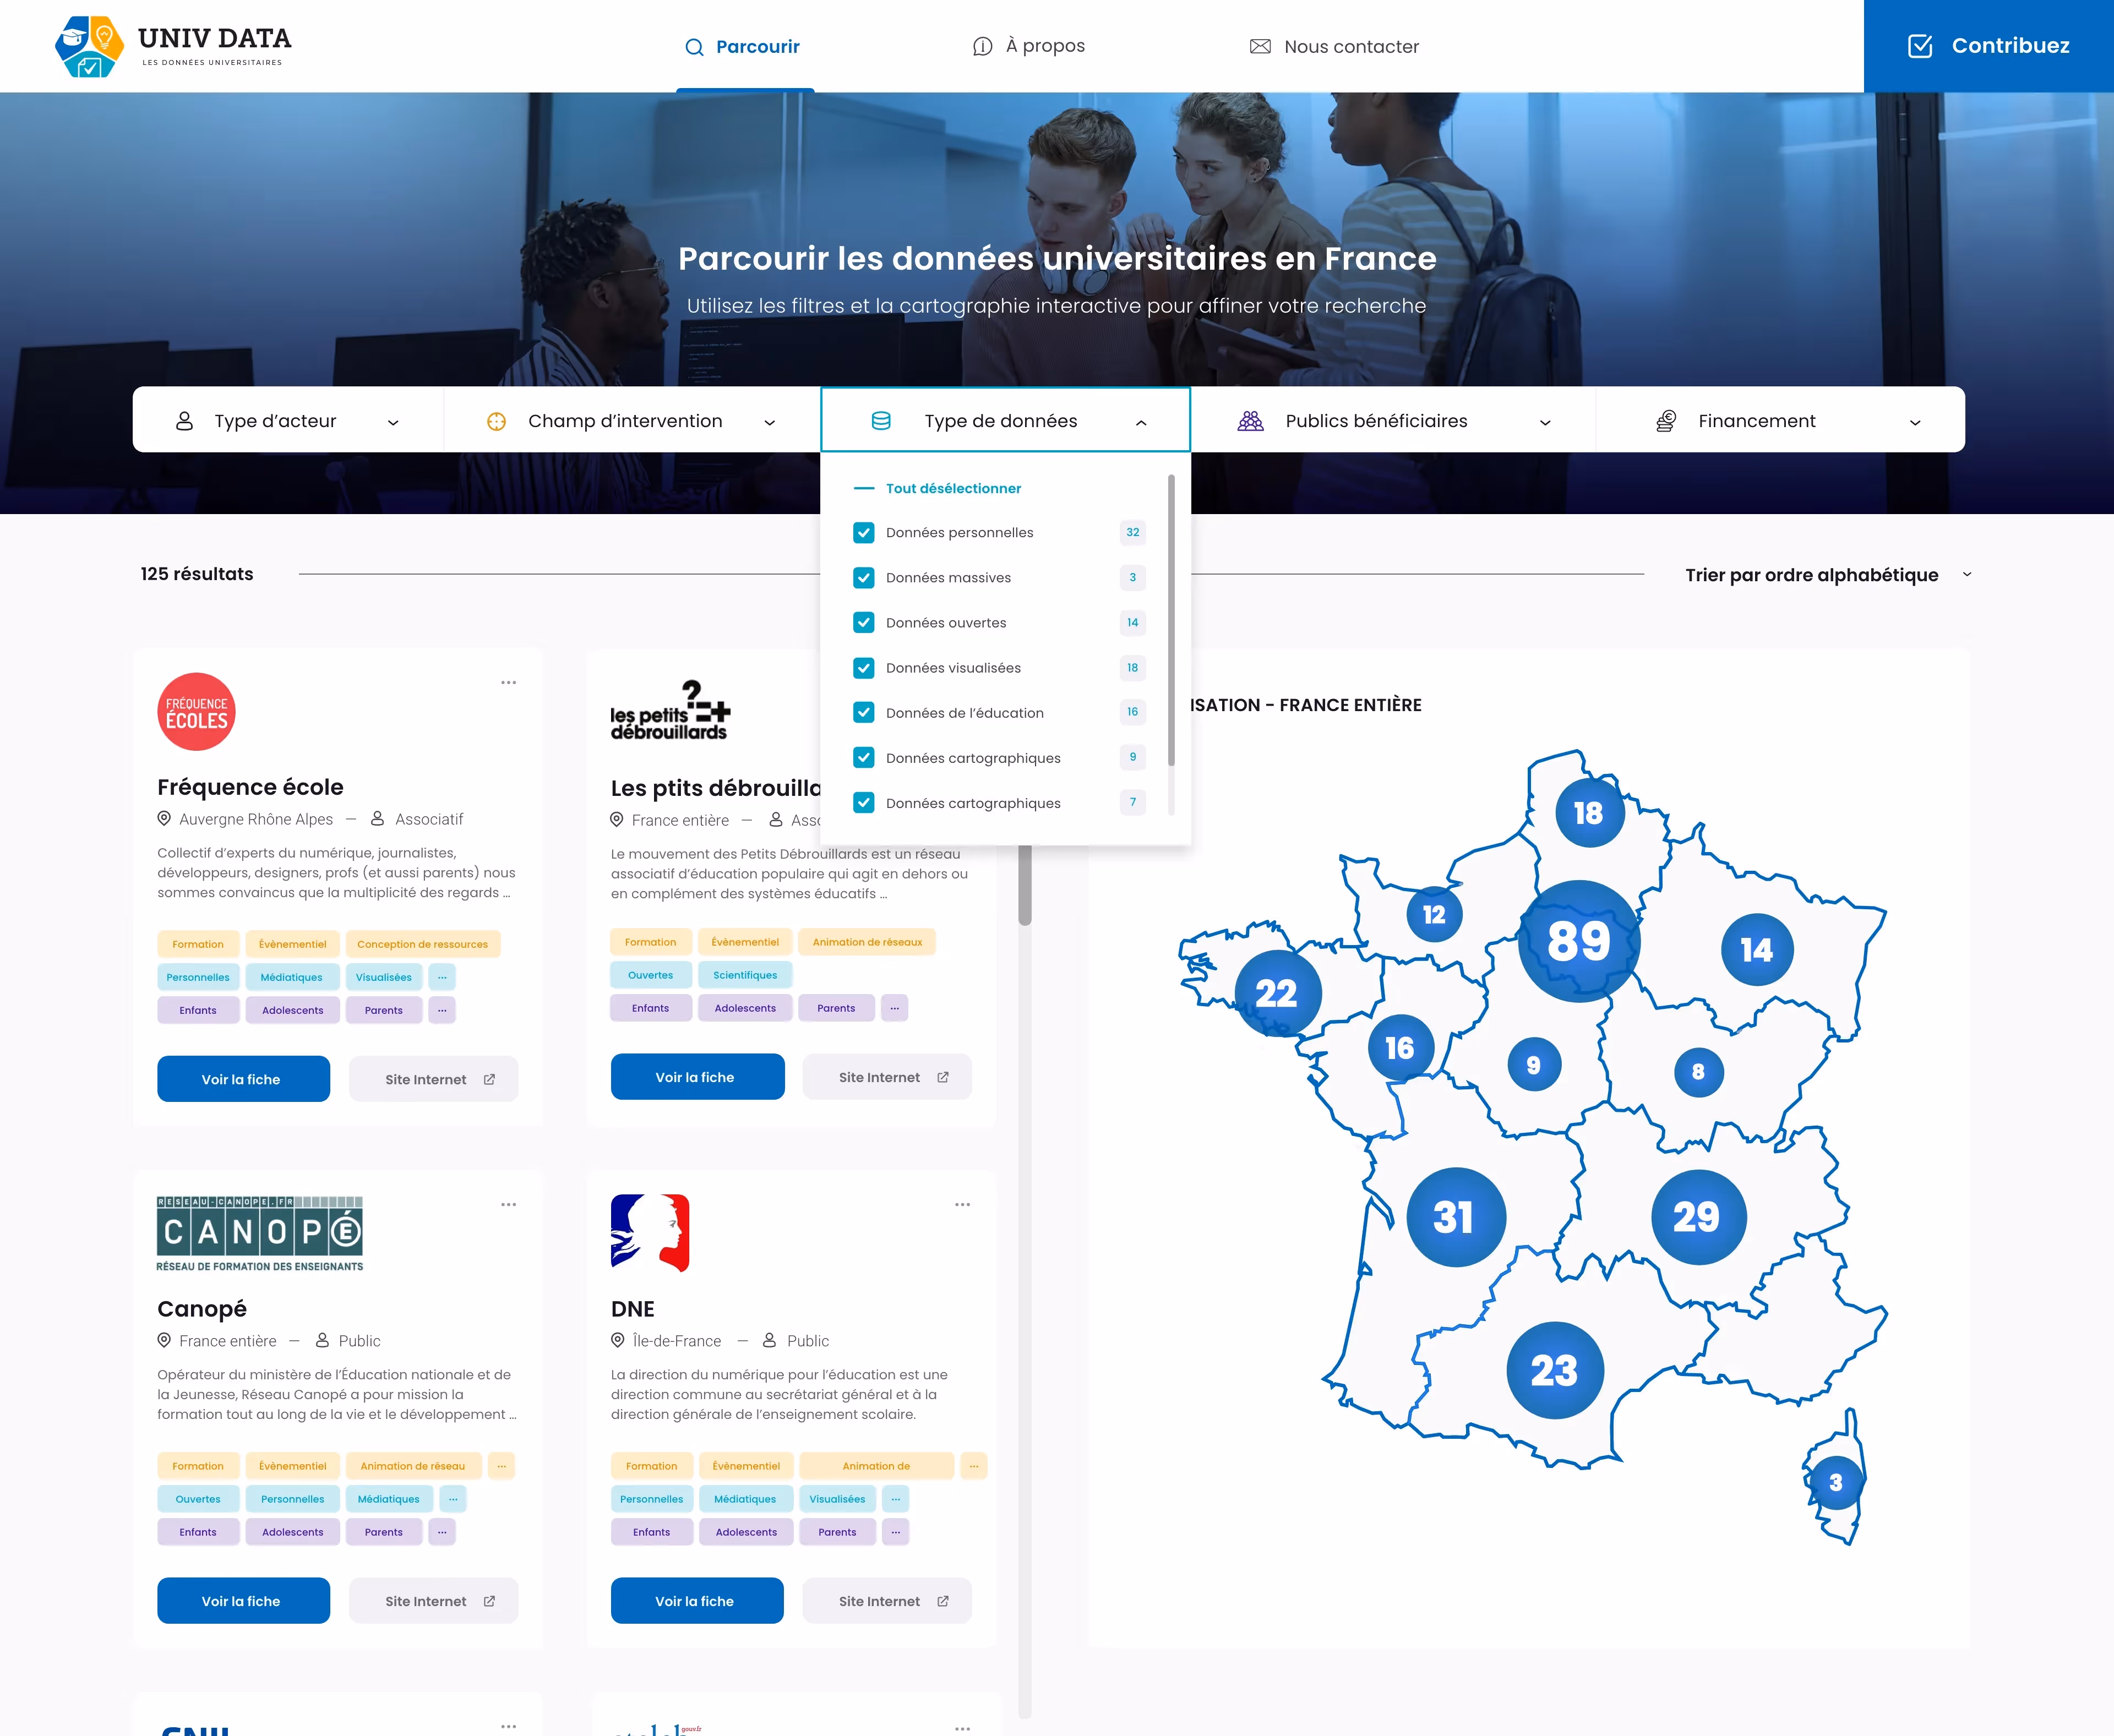
The solution
By combining Data Mapping and Data visualization, we created:
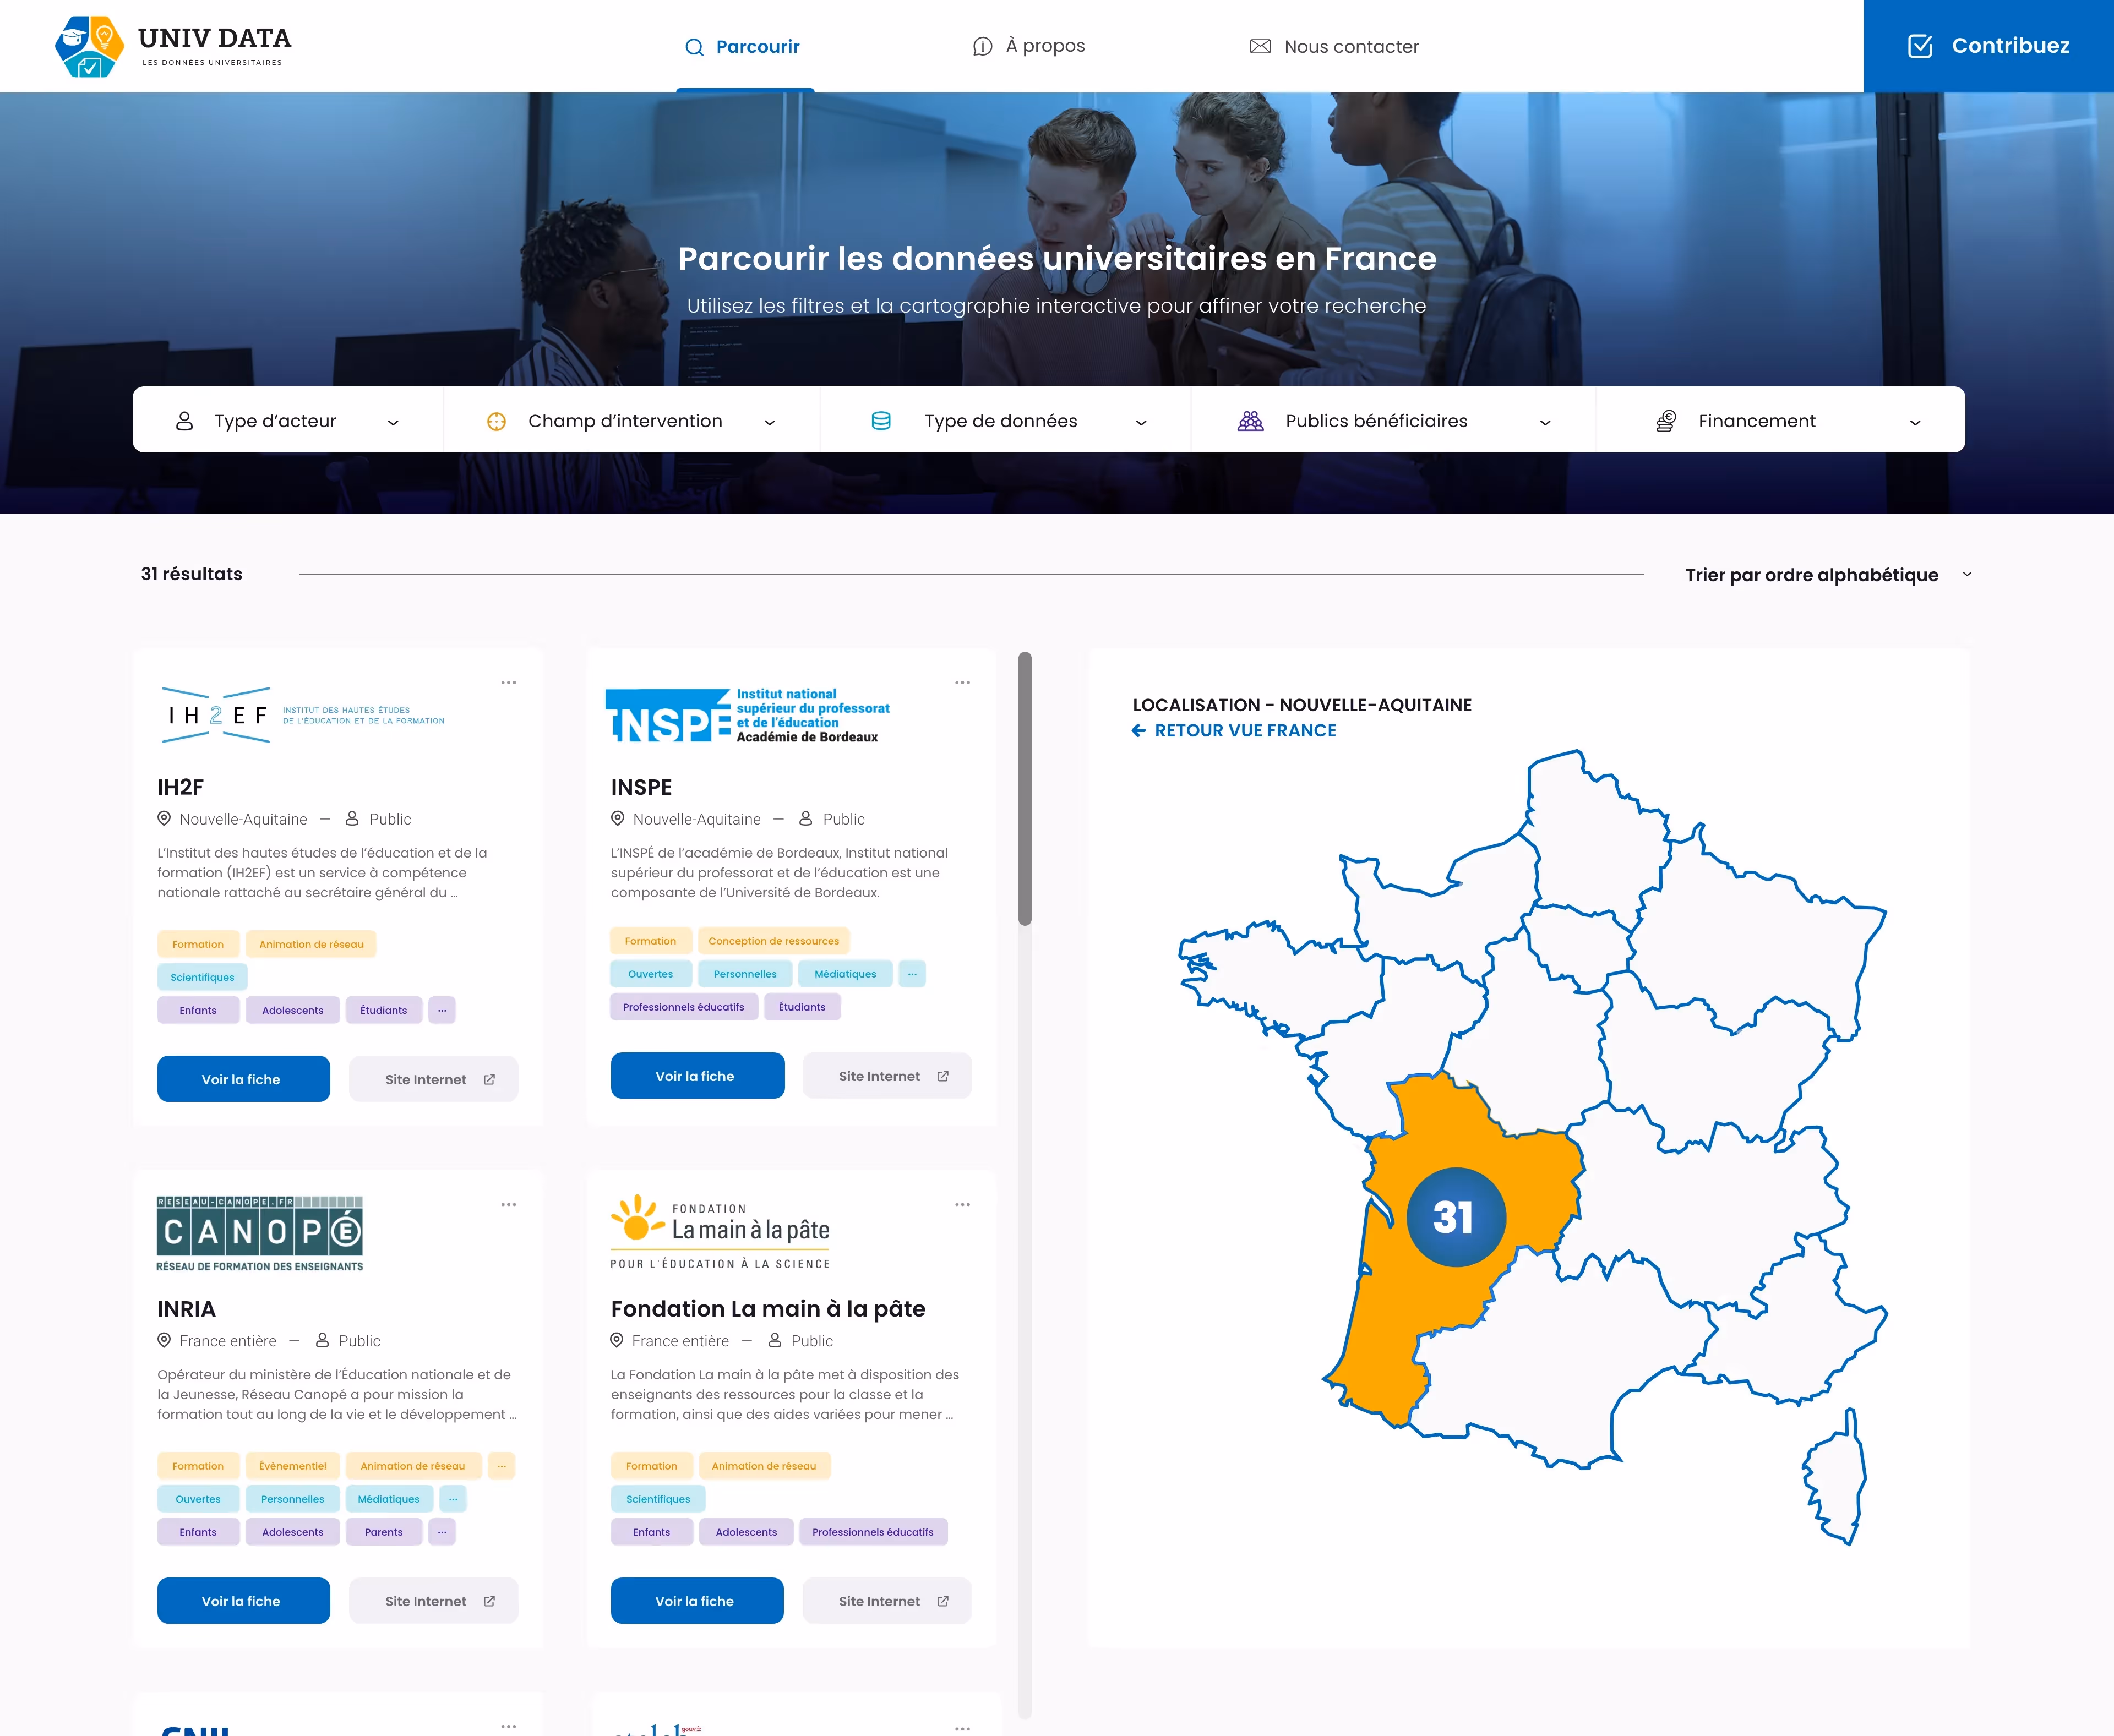
- An intelligent multi-criteria filtering interface
- A dynamic interactive map
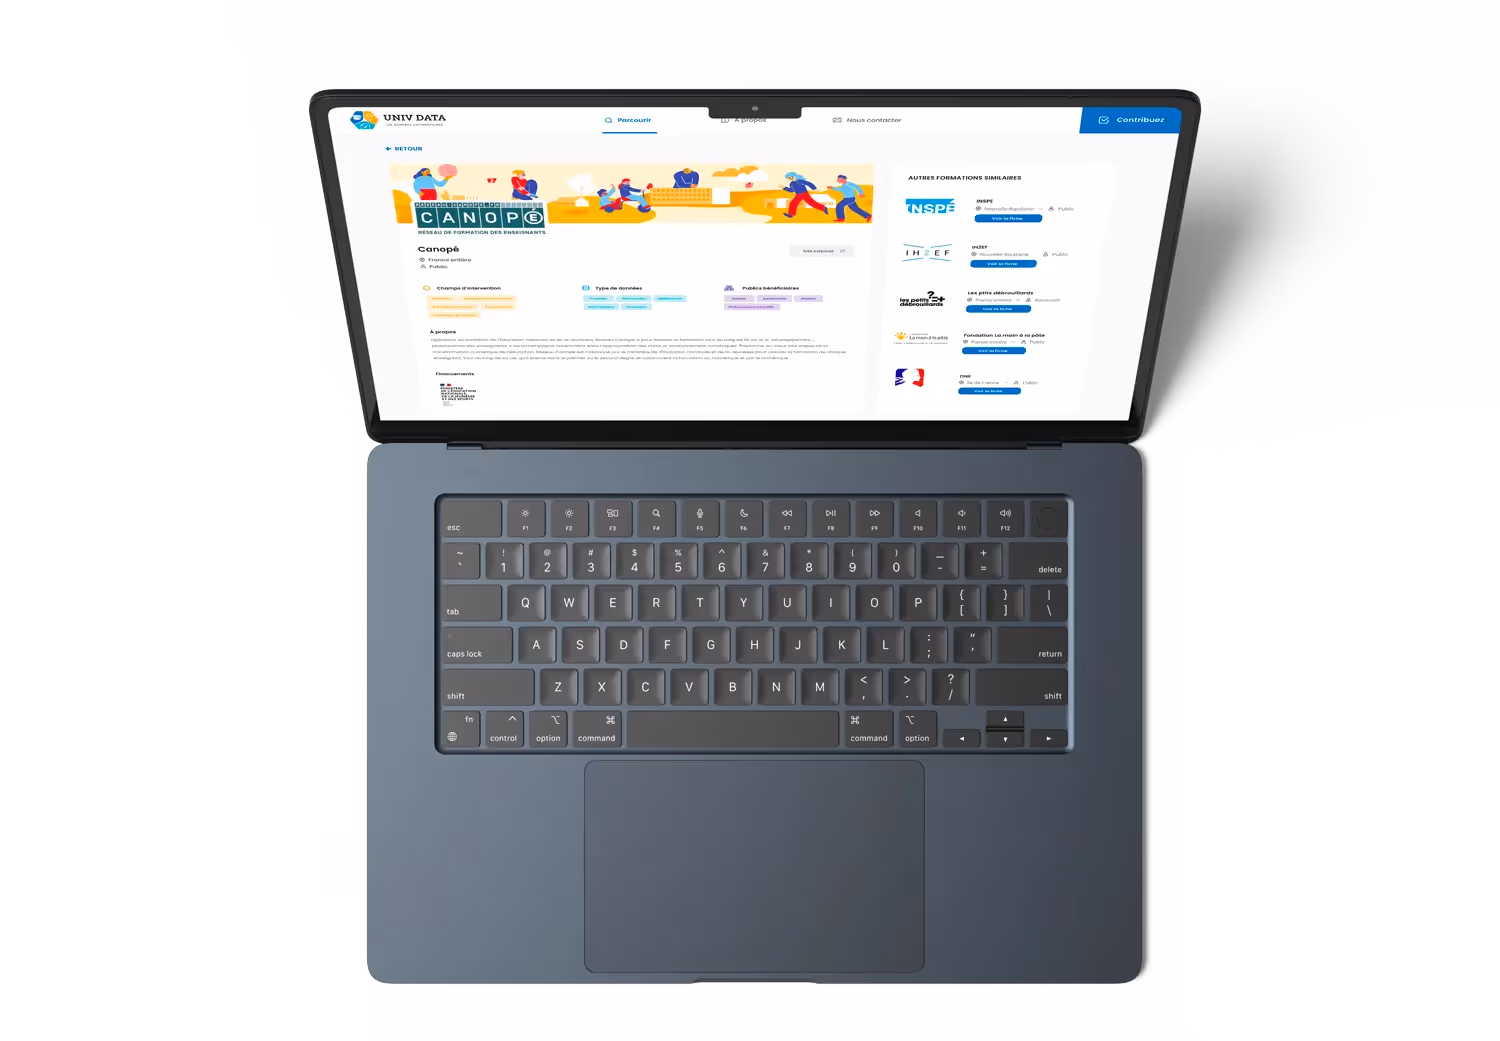
- A system of self-updated organizational sheets
The outcome
Our platform allowed:
- A democratization of access to research data
- Better collaboration between academic actors
- Increased transparency of university projects
This transformation illustrates how the alliance between custom data solutions and expertise in visualization can revolutionize access to academic knowledge while promoting scientific collaborations.


No items found.