

10h11 has developed a data visualization solution for the Hauts-de-France Region to identify and reduce equipment inequalities between municipalities.
Reducing territorial inequalities requires a detailed understanding of disparities. Our collaboration with the Hauts-de-France Region illustrates how data visualization can inform public policies.

The need
The Region had to address several challenges:
- Understanding equipment inequalities between municipalities
- Visualize complex data in an accessible way
- Directing public resources effectively
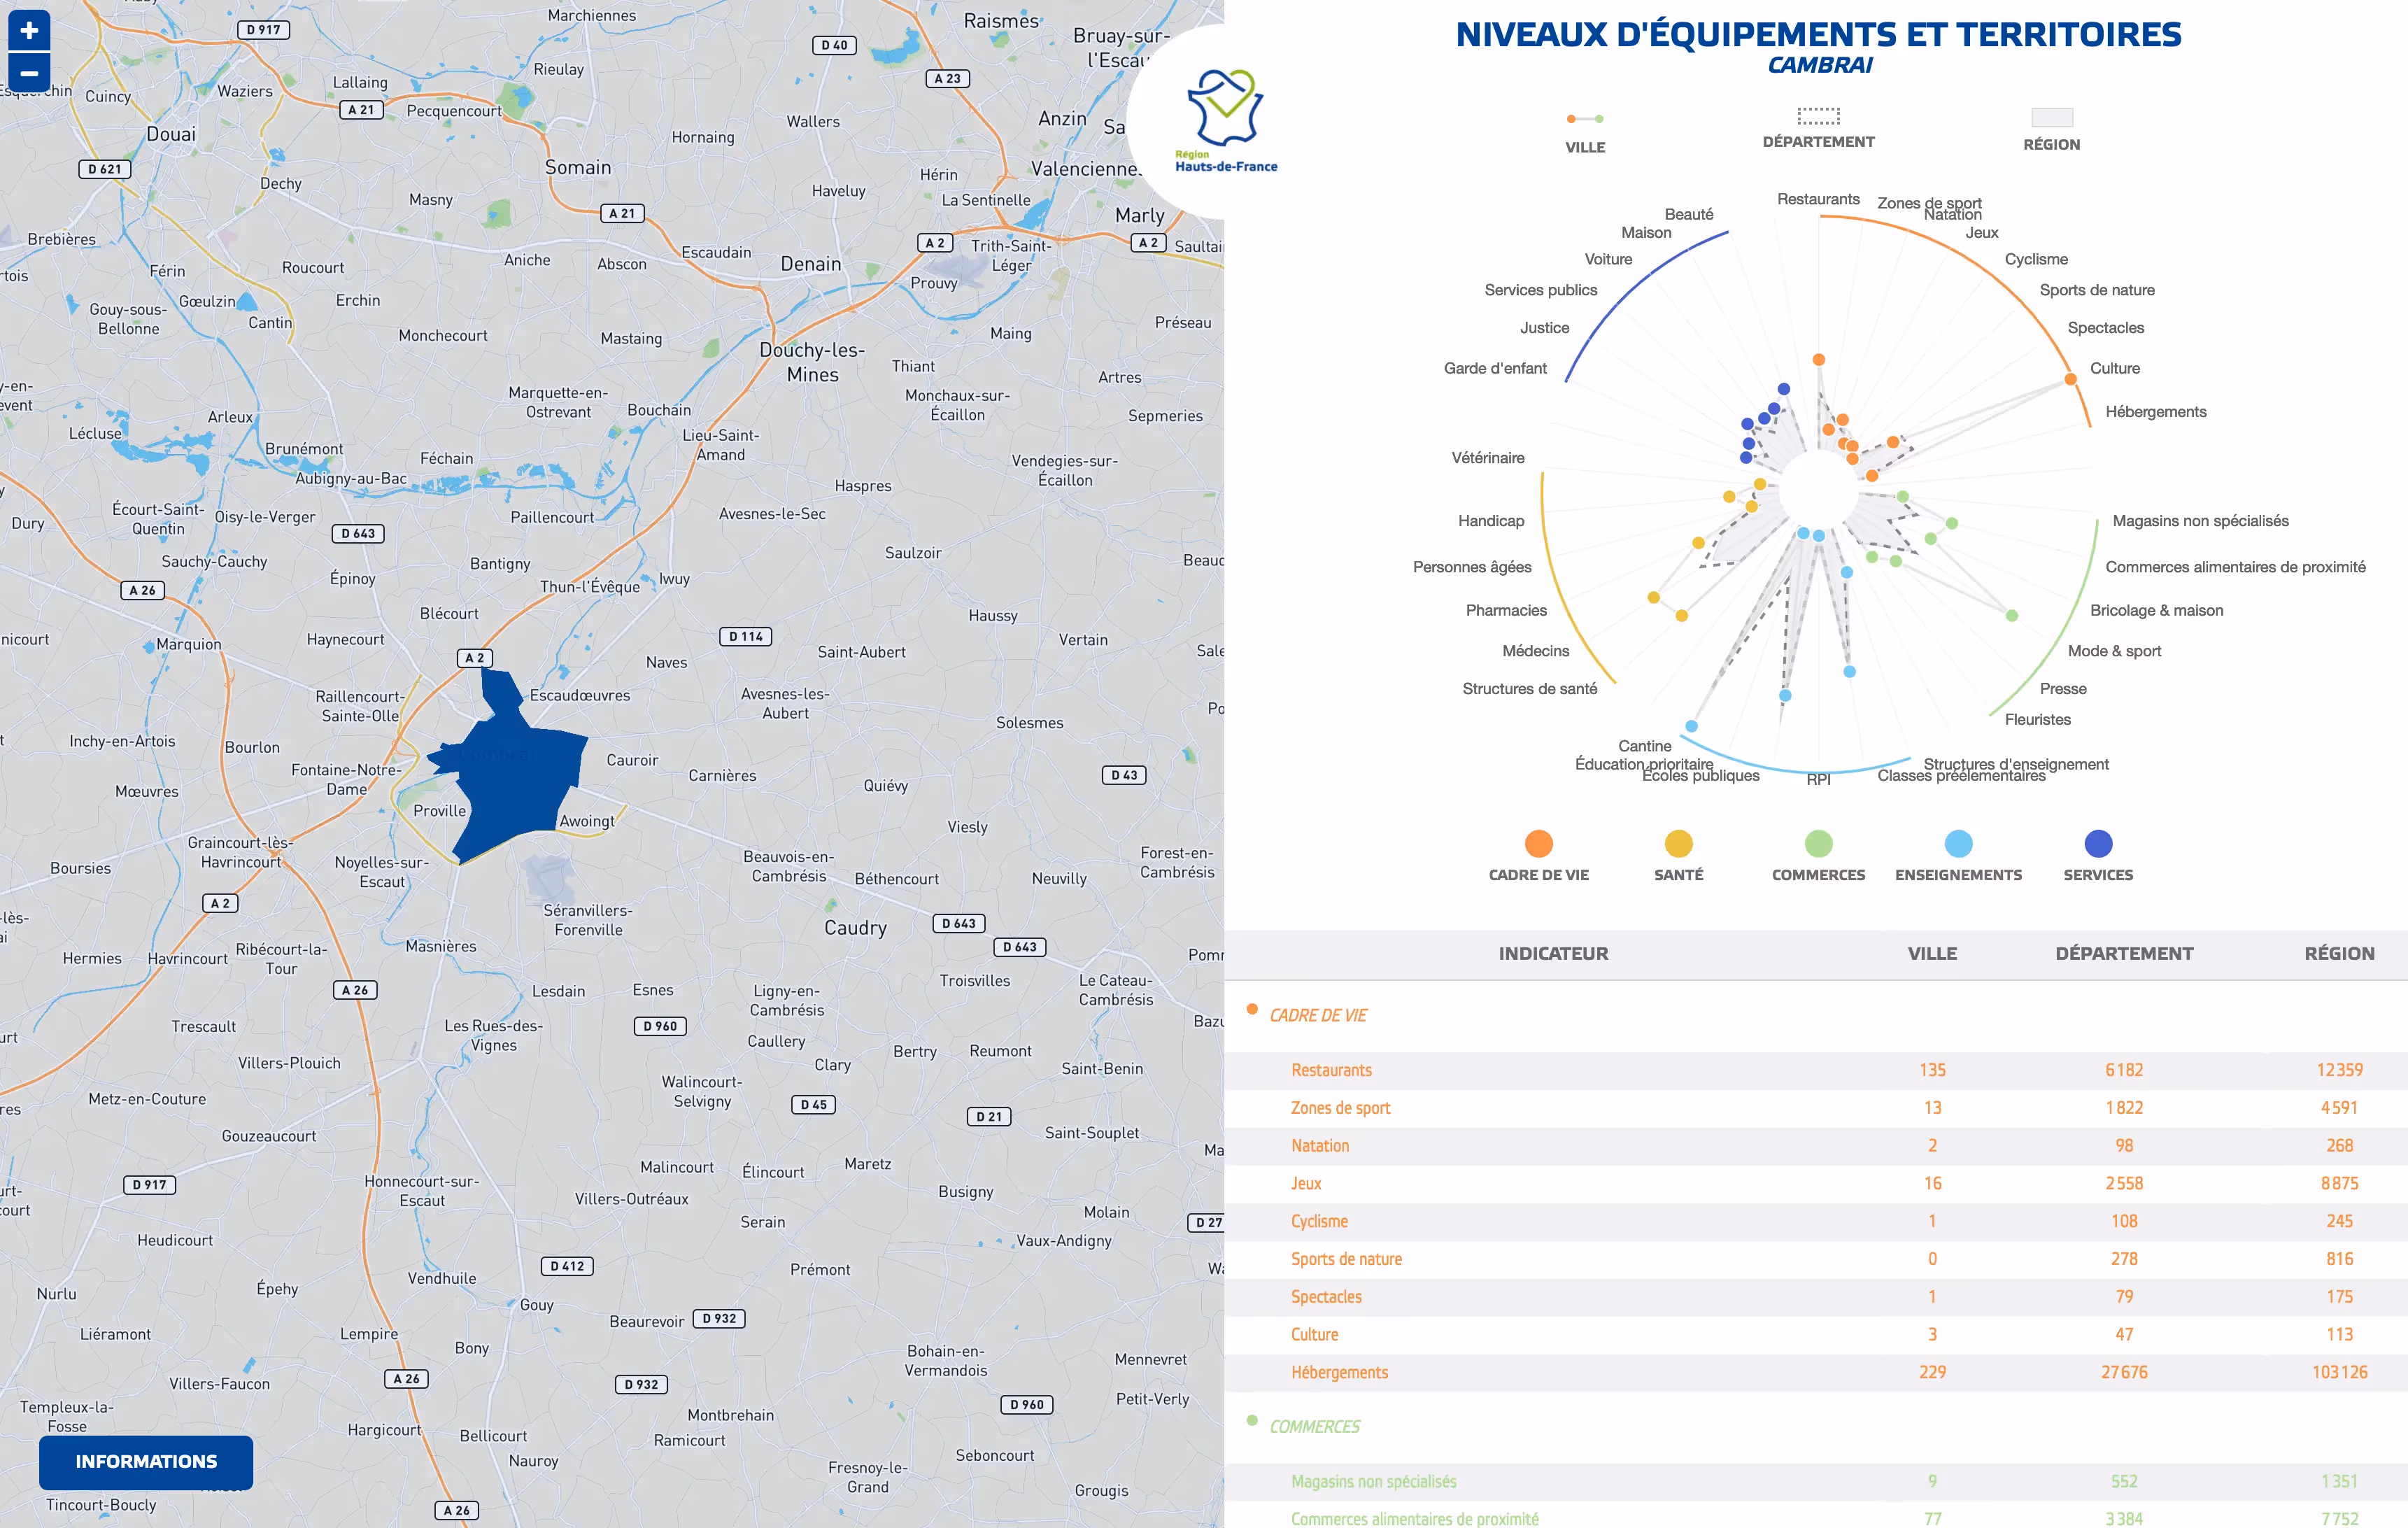
The solution
With the help of Open Data and innovative visualization, we created:
- An interactive multi-criteria map
- Comparative radar charts by domain
- An intuitive data exploration interface
The outcome
- Precise identification of under-equipped areas
- An informed reorientation of public policies
- A better allocation of territorial resources

No items found.