Élever la visualisation des données avec l'orchestration de données à grande échelle
Unifiez vos données d'entreprise avec des solutions d'automatisation des données et de visualisation intelligente.
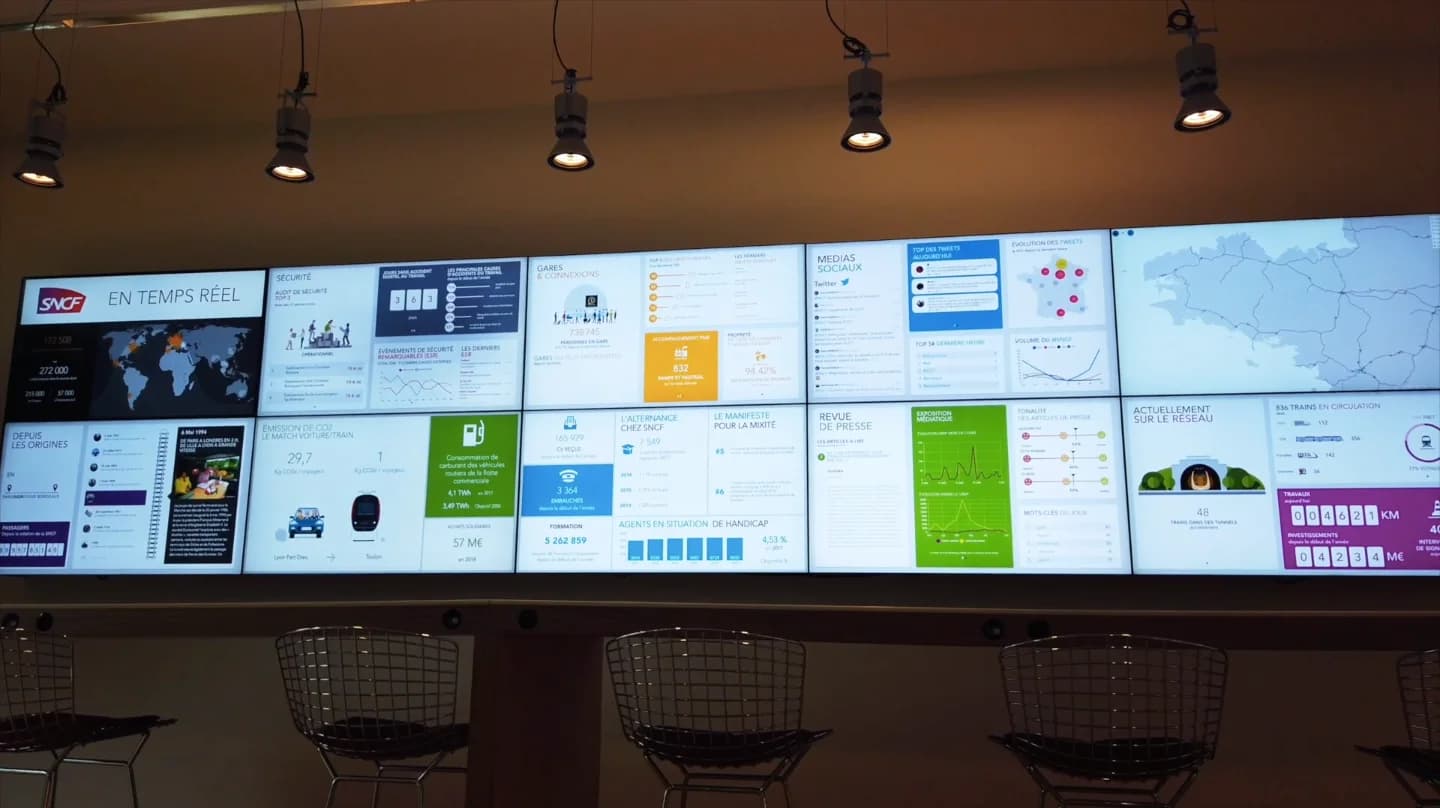
Harmoniser les données entre plusieurs unités d'affaires est un défi complexe. Notre collaboration avec SNCF montre comment l'ingénierie des données peut transformer la transparence opérationnelle.
Détails du projet
- Client
- SNCF
- Durée
- 10 mois
- Secteur
- Transport & Mobilité
Services
Analyse approfondie
Le défi
SNCF devait relever plusieurs défis majeurs : Unifier les données de 10 unités d'affaires distinctes Traiter plus de 100 jeux de données hétérogènes Rendre l'information accessible en ligne et sur site
Notre approche
Un système centralisé de collecte et de traitement des données Le plus grand Power BI datawall en Europe Une interface multi-support adaptative
Les résultats
Notre solution a permis : Une visualisation unifiée des données essentielles Une meilleure transparence opérationnelle Une prise de décision plus facile à tous les niveaux Cette réalisation démontre comment l'alliance entre des solutions de données sur mesure et une expertise en données peut transformer la communication interne d'une grande entreprise tout en optimisant ses performances opérationnelles.