
10h11 created for ADEME a series of innovative infographics and visualizations to effectively communicate the environmental impact of nursing homes in France.
Transforming complex data into accessible visualizations is a major challenge for public organizations. Our collaboration with ADEME shows how a data-driven approach can revolutionize environmental communication.

The need
ADEME was facing several complex challenges:
- Making complex environmental data on nursing homes accessible
- Transforming sociological studies into powerful visualizations
- Create effective communication materials
The solution
As experts in Automated Content Generation, we deployed:
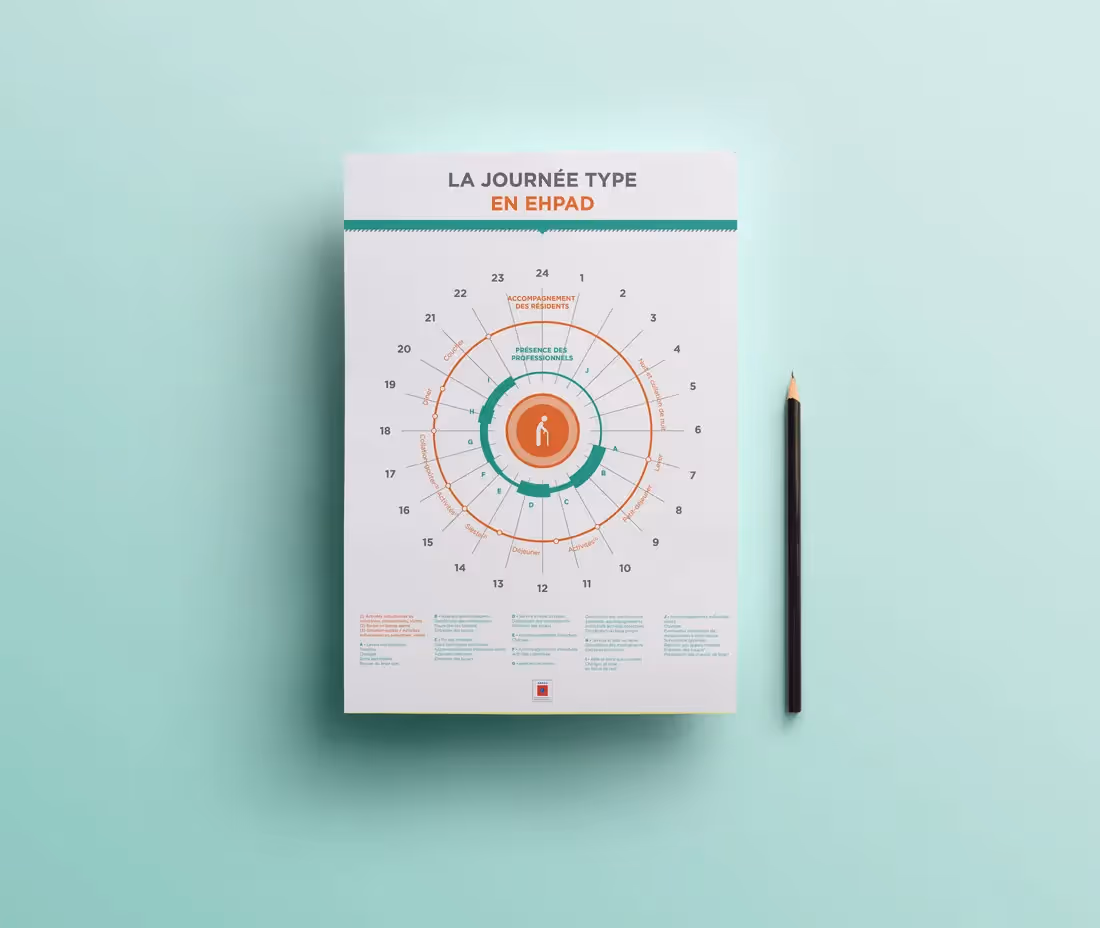
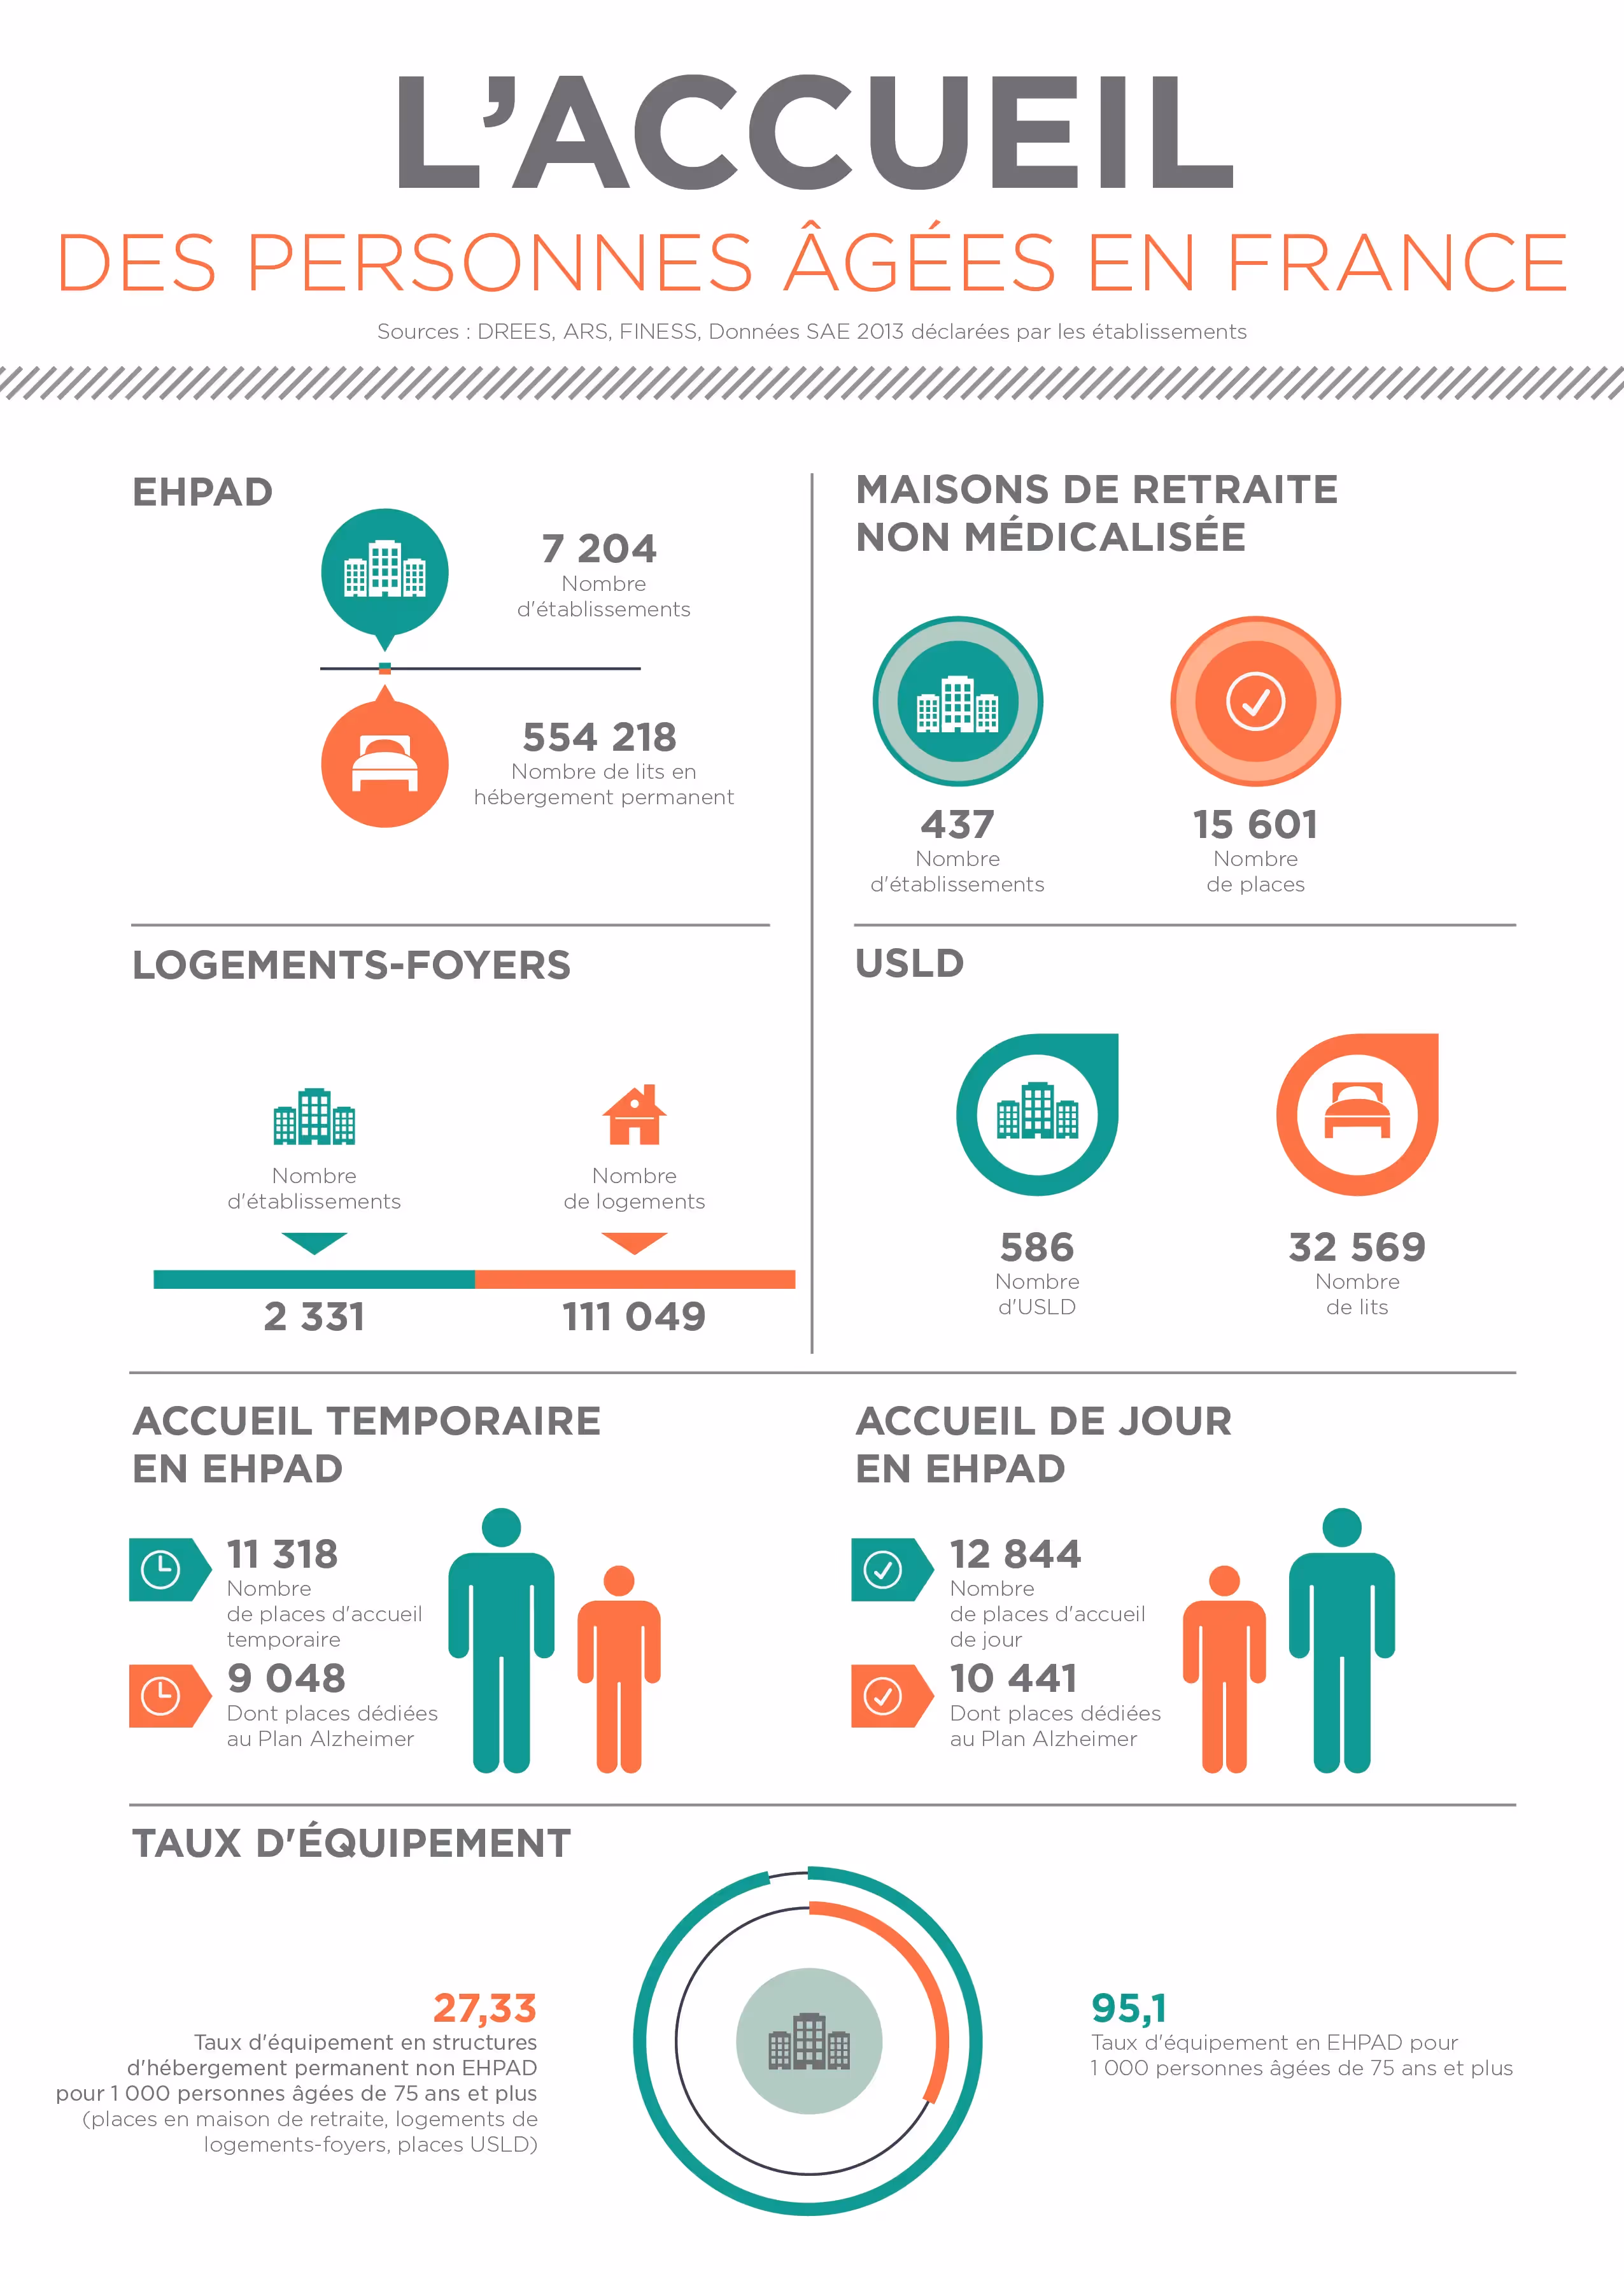
- Over 30 visualizations using data visualization
- Dynamic infographics based on Scenario simulation
The outcome
Our intervention resulted in:
- A better understanding of the environmental impact of nursing homes
- Interactive visualizations that facilitate decision making
- More Effective Communication of Environmental Issues
This transformation demonstrates how the alliance between data governance and visualization can make environmental and social data accessible to everyone, while maintaining its complexity and accuracy.

No items found.